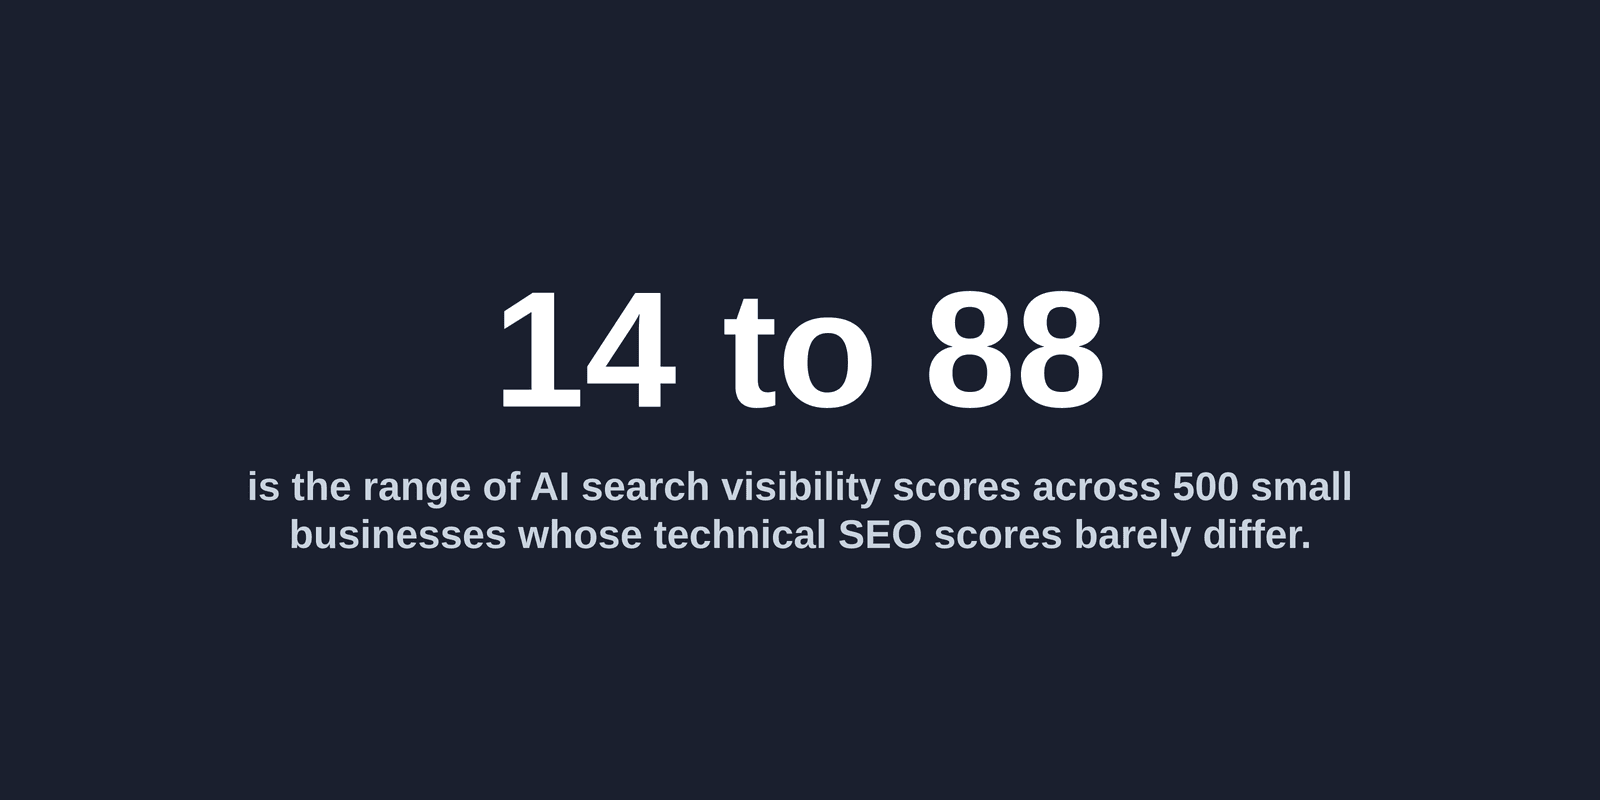
Across 500 small businesses, technical SEO scores sat in a tight band around 84 out of 100 while AI search visibility scores ran from 14 to 87.7. Same sites, same scan window, and one of those two numbers separates businesses far more than the other.
That is the practical answer to a question we get often: if the SEO is fine, is the AI search side fine too. This post shows what the spread of each score looks like across the Q2 2026 State of AI Search benchmark of 500 small and medium businesses, why the SEO number has so little to say about the AI number, and which work moves the one that varies.
One layer barely varies, the other varies a lot
We scored every business on three separate layers. Technical health covers the SEO basics: speed, mobile rendering, indexability, tags. It averaged 84.1 out of 100 with a median of 85 and a standard deviation of 4.8, which is another way of saying almost everyone lands in the same place. AI visibility, whether ChatGPT, Claude and Gemini actually mention a business when a customer asks about its category, averaged 73.4 with a median of 74.7 and a standard deviation of 10.1.
Put the two side by side and the shapes differ more than the averages do. The band within one standard deviation of the mean covers roughly 79 to 89 for technical health and roughly 63 to 84 for AI visibility, so the AI layer spreads more than twice as widely.
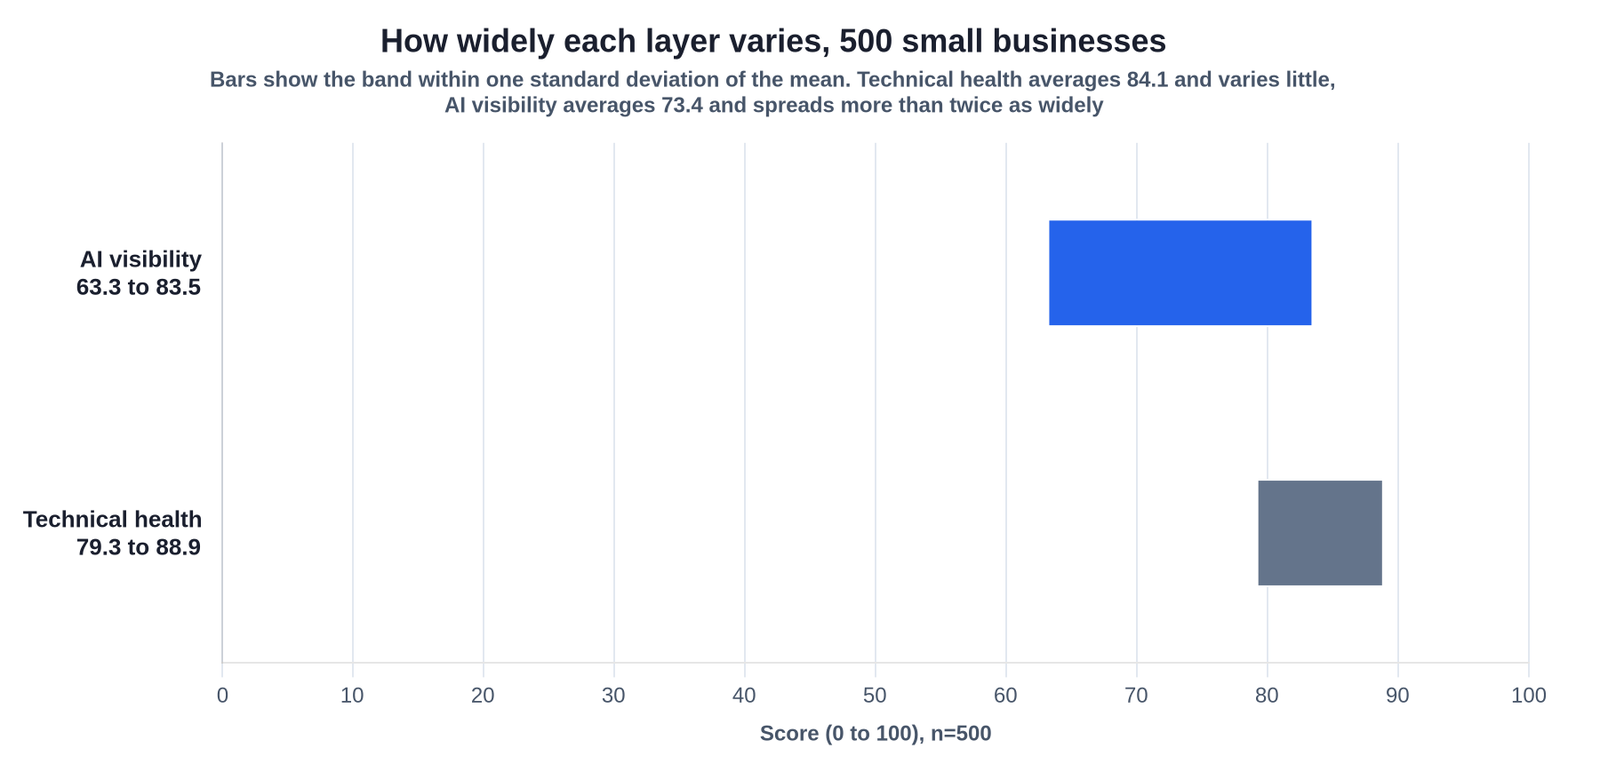
The extremes make the same point without any statistics. The lowest AI visibility score in the sample was 14 and the highest was 87.7. Businesses whose SEO scores are almost indistinguishable can sit at opposite ends of that range.
Why a good SEO score cannot tell you much
A measure that hardly moves cannot explain one that moves a great deal. If nearly every business scores in the low to mid eighties on technical health, that number cannot be the reason one of them gets recommended by an assistant and the next one does not. It is a pass mark, not a ranking.
What is still unfixed on these sites shows why. The classic plumbing faults are comparatively rare in our scan: slow page load was flagged on 20.2 percent of sites, missing or duplicate title tags on 14.8 percent, and pages that were not mobile responsive on 6.8 percent. The faults that concern how plainly a site states what it is are close to universal. Meta description tags needed work on 94.4 percent of sites, schema markup on 66.2 percent, and every single one of the 500 businesses had at least one open recommendation about how AI describes their brand.
A dental practice in Nottingham can pass every technical check, load in under a second and still give an assistant nothing to work with beyond a page title and a phone number. Nothing states which treatments it offers, which area it serves, or what makes it a sensible answer to the question a patient actually asked. The site is healthy. It is also silent on everything the assistant needs.
The industry averages tell the same story
The pattern holds when you split the sample by sector. Across the six industries with samples large enough to report, technical health runs from 83.5 to 84.5, a difference of about one point. AI visibility over the same six runs from 70.4 for professional services to 74.8 for marketing agencies, a spread of 4.4 points. The SEO layer is flat wherever you look, and the AI layer is not.
This is why an industry average is a poor guide to your own position. A garden centre in Kent and a Belfast IT support firm sit in different sectors with near-identical technical health, and neither sector average tells either of them whether an assistant can describe what they do. The variation that matters sits inside industries, between businesses that have done the second layer of work and businesses that have not.
What moves the score that actually varies
The work is specific and mostly unglamorous. State plainly, in text an assistant can read, what you sell and who you serve. Replace the placeholder meta description that came with the theme. Mark the business up with structured data so its type, location and services are machine readable, which was the single most common gap after the tags. Answer the questions customers actually ask on pages of their own. Then build the outside evidence, reviews and listings and coverage, that a cautious assistant checks before it repeats a claim.
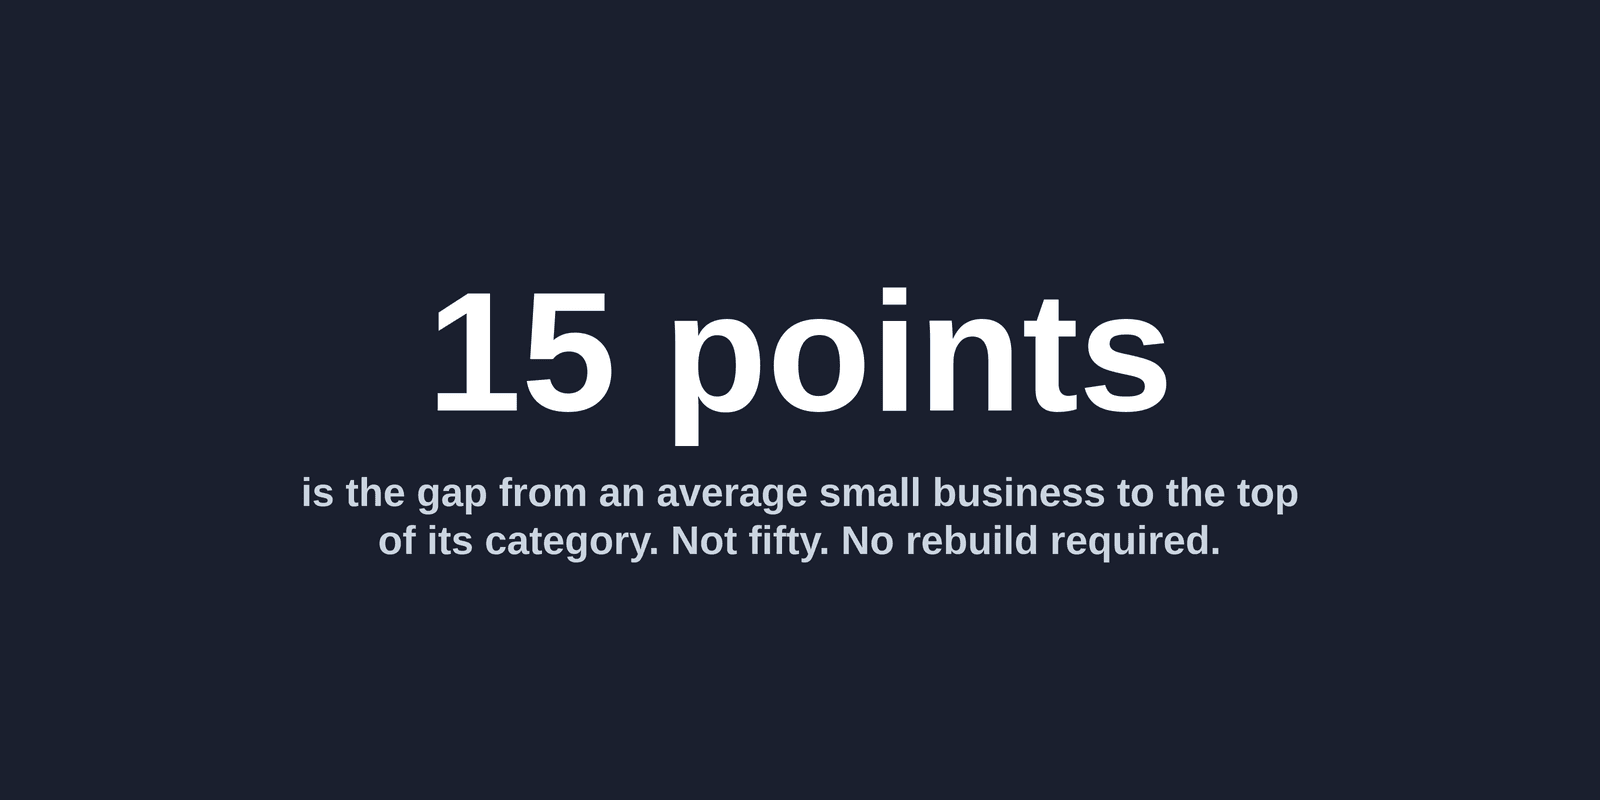
The volume is manageable. The typical business in the sample carried 9.2 high-priority items, and the distance from the sample average of 73.4 to the best score we recorded, 87.7, is about 14 points rather than 50. None of it is a redesign.
This is the layer AI My Site was built to add. It scans your site on each assistant, reports the three scores separately so you can see which one is holding you back, then ranks every relevant issue by its effect on AI visibility with the recommended wording for each and guides for your platform. You work down the list in order. The action plan, not just the audit.
Common mistakes to avoid
- Reading a strong technical score as an AI search result. Technical health averaged 84.1 across the sample and barely varied, so it cannot tell you where you sit on the layer that does vary.
- Adding more SEO work to fix an AI visibility gap. More speed and more backlinks lift a number that is already high for most businesses. The gap sits in structure and clarity.
- Judging yourself against an industry average. The six reportable industries differ by 4.4 points on AI visibility while individual scores run from 14 to 87.7. The sector figure hides almost everything.
- Leaving the theme defaults in place. Meta description tags needed work on 94.4 percent of the sites we scanned and schema markup on 66.2 percent. Both are the plainest statements a site makes about itself.
- Waiting for one big project. The typical site carried 9.2 high-priority items. That is a sequence of small fixes, not a rebuild.
How long does this take
Seeing your three scores is same-day work. Acting on them splits into two halves. The on-site half, clearer positioning, honest tags and structured data, is an afternoon of writing plus a few hours of follow-up across your main pages. The external half, reviews and listings and being written about, accrues over weeks because it is not entirely in your hands. In practice, businesses that work through a prioritised list tend to see movement over a 4 to 12 week window, depending on how many items they carry and how consistently they apply them. Nobody can promise a particular assistant will name you by a particular date, and anyone who does is guessing. What the data supports is narrower and still useful: the AI layer is where small businesses differ, and the leading sites in our sample got there by doing this work.
Frequently asked questions
Does good SEO help my AI search visibility at all?
It is necessary and not sufficient. An assistant cannot use a site it cannot reach or read, so the technical basics matter. They simply do not separate businesses any more: technical health averaged 84.1 out of 100 across our 500-business sample with a standard deviation of 4.8, so almost everyone has cleared that bar.
Why is AI visibility so much more variable?
Because the work behind it is less standardised. Speed and mobile rendering come largely from your platform and hosting, which most modern setups handle. Clear positioning, structured data and external corroboration are choices each business makes or skips, so the results fan out. AI visibility had a standard deviation of 10.1 against 4.8 for technical health.
My site ranks well on Google. Why would an assistant miss me?
Ranking means a search engine can match your pages to a query. Being recommended means an assistant can summarise what you do confidently enough to put your name in an answer. The second needs a plain description of the business, structured data that states its type, and outside sources that agree.
Which score should I try to move first?
The one you are furthest behind on, which for most businesses in our sample was not technical health. Start with the tags and schema markup, since those were the two most common gaps at 94.4 percent and 66.2 percent of sites, and they are the fixes that state what your business is.
How big is the gap between an average and a leading site?
On AI visibility, about 14 points: the sample averaged 73.4 and the best score we recorded was 87.7. The typical site carried 9.2 high-priority items, so the distance is made of specific fixes rather than a rebuild.
See where you sit
If the SEO layer is flat and the AI layer is where businesses differ, the useful question is where your own two numbers fall. We have published the full Q2 2026 State of AI Search benchmark, with the pillar means and spreads, the score distribution, the prevalence of each issue and the breakdown by industry, country and platform, so you can compare.
Read the full Q2 2026 benchmark to see where you sit.
AI My Site Research · Q2 2026 · n=500. Technical health mean 84.1, standard deviation 4.8. AI visibility mean 73.4, standard deviation 10.1, per-site scores from 14 to 87.7. Industry figures cover the six industries with samples large enough to report. We measured AI search visibility, not revenue or conversion. Figures are a Q2 2026 point-in-time snapshot.
See how your own site scores
AI My Site checks all of this automatically and gives you a prioritised, plain-English plan for what to fix first.
Get your scores — £60/month →