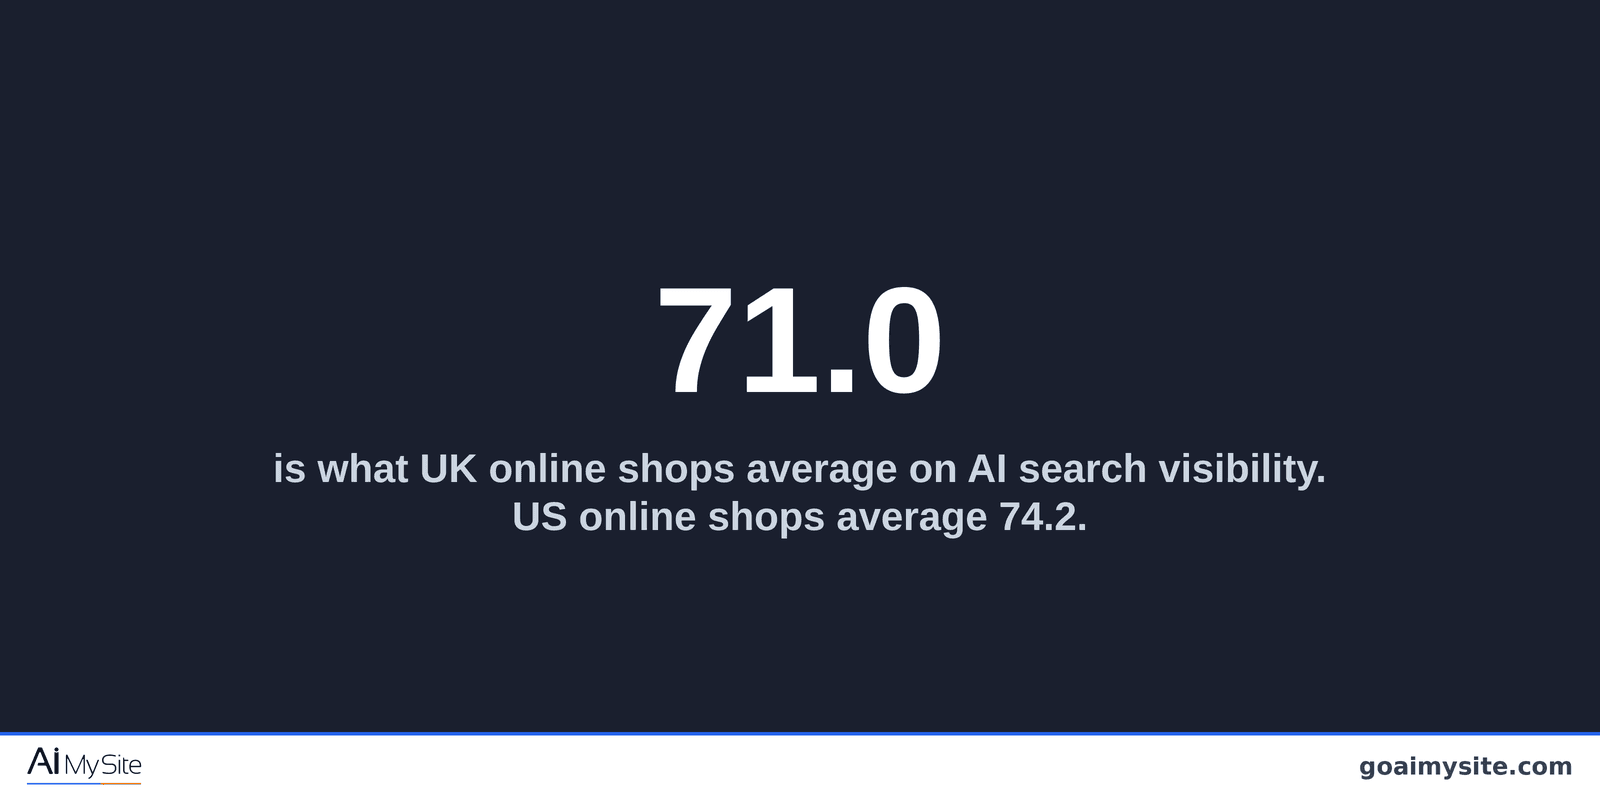
The 51 UK online shops in our Q2 2026 scan averaged 71.0 out of 100 for AI search visibility, against 74.2 for the 33 US online shops we scanned. Online shops are the second largest industry in the sample and one of only three sectors where the UK sits behind the US.
This post covers how large that gap really is, why a shop with a catalogue tends to lose ground on this measure, and which pages are worth fixing first.
Where UK online shops actually sit
Across all 99 online shops we scanned, in every country, AI search visibility averaged 73.0 out of 100 with a midpoint of 74.3. Split that by country and the UK cohort, the largest single group of shops in the sample at 51 businesses, comes in at 71.0. The 33 US shops come in at 74.2. The UK cohort also sits below the UK average across all industries, which is 72.4 across 251 businesses, and below the all-sample average of 73.4.
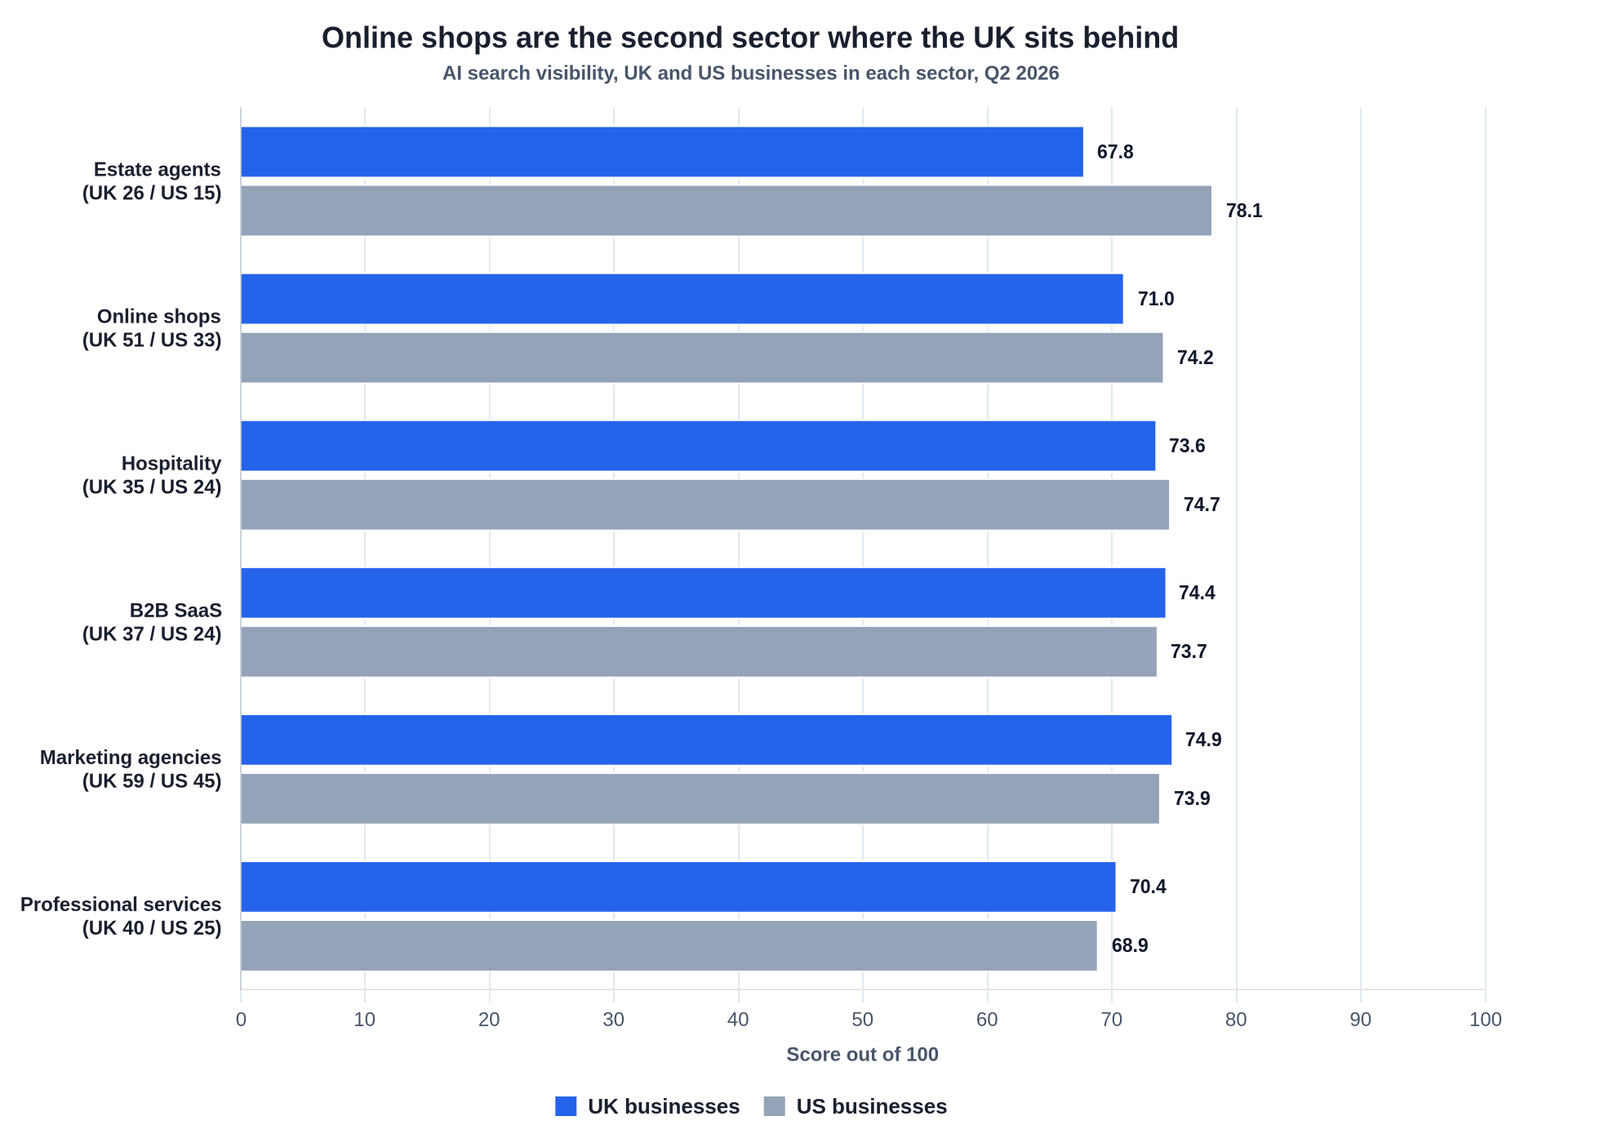
Three of the six sectors we could report on have the UK behind the US, and online shops are the second widest of the three. Keep the size of it in proportion, though. The gap is a little over three points, while the standard deviation across the whole sample is 10.1, so the ordinary spread between two businesses is roughly three times the spread between the two countries. Both cohorts sit inside the same Good band, the 60 to 79 range that holds 69.2 percent of everything we scanned. What the number is useful for is benchmarking: a UK shop measuring itself against the headline 73.4 is measuring itself against a figure its own cohort does not reach.
Why a catalogue loses ground on this measure
An online shop has more pages than almost any other kind of small business site. A consultancy has a handful. A kitchenware shop in Leicester has one page per product, one per category, and often more again for filtered views of the same stock. Almost none of those pages were written by hand. They come out of a template, and the template fills in the title and the description from the product name.
That is where the ground is lost, because those two fields are what an assistant reads first when it is working out what a site is for. A title that reads as a product code followed by the shop name tells ChatGPT, Claude or Gemini the product code and the shop name. It does not say what kind of shop this is, what it stocks, or who it serves. Across the whole sample, meta description tags were unresolved on 94.4 percent of businesses, page titles on 92.2 percent, keywords tags on 85.2 percent and schema markup on 66.2 percent. A shop with 400 templated pages carries that pattern 400 times over rather than four.
The same effect works in reverse for the shops that did well. A cycling parts retailer in Bristol that has written its category pages properly, in the words a customer would use, has given an assistant something to quote in answer to a question about where to buy that part. That is a writing job on a small number of pages, not a rebuild of the catalogue.
The shops are not broken, they are quiet
It would be reasonable to assume a lower visibility figure means slower, creakier websites, and the data does not support that. Broken out into the three layers we score, online shops averaged 83.7 on technical health, 74.1 on AI readiness and 73.0 on AI search visibility. Technical health is the healthiest of the three by a wide margin, which is what you would expect from a sector where a slow checkout costs money the same week. The shops work. What they are not doing is saying, in plain language on the pages that matter, what they sell and who they sell it to.
What closes the gap
The work is narrower than the page count suggests, because you do not need to touch every product. Start with the category pages, which are the ones a customer's question actually maps onto, and the small number of pages that explain what the shop is. On each of those, write a title and a description that name the category in the words a shopper would use rather than the words your stock system uses. Add the schema markup that tells an assistant what kind of business this is and what it sells. Then answer the questions a shopper asks before buying, on the page, in text, rather than leaving them to a chat widget. A pet supplies shop in Hull can get through the category layer in a week of evenings.
This is where AI My Site fits. It scans your site, reports your figure on each of the three layers separately, lists the items that are open, gives you the recommended title, description and schema values rather than only flagging that they need work, and ranks the list so you know which pages to start on. The action plan, not just the audit.
Common mistakes to avoid
- Reading three points as a verdict on UK shops. The gap is 71.0 against 74.2 on cohorts of 51 and 33 businesses, and the sample-wide standard deviation is 10.1. It is a benchmark worth knowing, not a national failure.
- Leaving titles and descriptions to the template. Product name plus shop name is the default in most catalogues, and it is also the least informative thing those two fields could say. Descriptions were unresolved on 94.4 percent of the sample.
- Working through products and skipping categories. Customer questions land on categories far more often than on a single item. The category page is the one an assistant can quote when somebody asks where to buy something.
- Assuming the shop platform has done your schema. Schema markup was unresolved on 66.2 percent of everything we scanned. Most platforms ship some of it and leave the parts that describe your business to you.
- Treating this as a technical project. Online shops averaged 83.7 on technical health, the strongest of their three layers. The gap here is in what the pages say, not in how fast they load.
How long does this take
Auditing which items are open on your shop is an afternoon. The category layer is the bulk of the work and it is writing rather than configuration, so budget an hour or two per category page if you want the copy to be any good. Schema markup for a shop is an hour or two in total once you have the right template, and titles and descriptions are minutes per page after you have decided the pattern. Businesses that work through a prioritised list tend to see movement over a 4 to 12 week window, depending on how many categories they carry and how consistently they apply the changes. We cannot give you a date, and we would not trust anyone who did. What our data supports is narrower: UK online shops average 71.0, US online shops average 74.2, and the items most often left open are the ones on the pages you would fix first anyway.
Frequently asked questions
What is a good AI search visibility score for an online shop?
Across the 99 online shops in our Q2 2026 scan the average is 73.0 out of 100 and the midpoint is 74.3. By country, UK shops average 71.0 across 51 businesses and US shops average 74.2 across 33. Anything at 80 or above puts you in the best-scoring 26.2 percent of the whole sample.
Why do UK online shops score lower than US ones?
We measured the scores, not the causes, so we will not pretend to know. What we can say is that the gap is a little over three points on cohorts of 51 and 33, that both cohorts sit in the same Good band, and that the items left open across the whole sample are the same everywhere: descriptions, titles and schema markup.
Is a three-point gap worth acting on?
Not on its own. It is worth acting on the items behind it, which are the same items that separate a typical shop from the best performers in our sample, and that distance is larger. The sample average is 73.4 and the highest-scoring businesses we scanned reached 87.7.
What should an online shop fix first?
Look in prevalence order, because that is where the odds are: meta descriptions were unresolved on 94.4 percent of businesses, page titles on 92.2 percent, keywords tags on 85.2 percent and schema markup on 66.2 percent. We measured which items are open, not how many points each one is worth, so treat that as the order to look in rather than a promise.
Which AI assistants did you measure?
ChatGPT, Claude and Gemini. Every headline number in this post is the mean of those three. We also scanned Perplexity but excluded it from the headline figures because of its reduced usage relevance, and its numbers sit in the methodology appendix.
See where you sit
A cohort average tells you where the field is. It does not tell you which of your category pages an assistant can read. We have published the full Q2 2026 State of AI Search benchmark, including the sector and country breakdowns behind the numbers in this post, the three-layer split, and the issue prevalence table, so you can see how your shop compares before you change anything.
Read the full Q2 2026 benchmark to see where you sit.
AI My Site Research · Q2 2026 · n=500. Ecommerce n=99, mean 73.0, median 74.3. UK ecommerce n=51, mean 71.0. US ecommerce n=33, mean 74.2. UK all industries n=251, mean 72.4. Sample mean 73.4, standard deviation 10.1. Ecommerce by layer: technical health 83.7, AI readiness 74.1, AI search visibility 73.0. We measured AI search visibility, not revenue or conversion. Figures are a Q2 2026 point-in-time snapshot.
Rather someone did this for you?
With One Site we rebuild your website and run it for you: a review every fortnight, technical fixes done ourselves, and the content changes you approve.
See One Site — £60 a month →