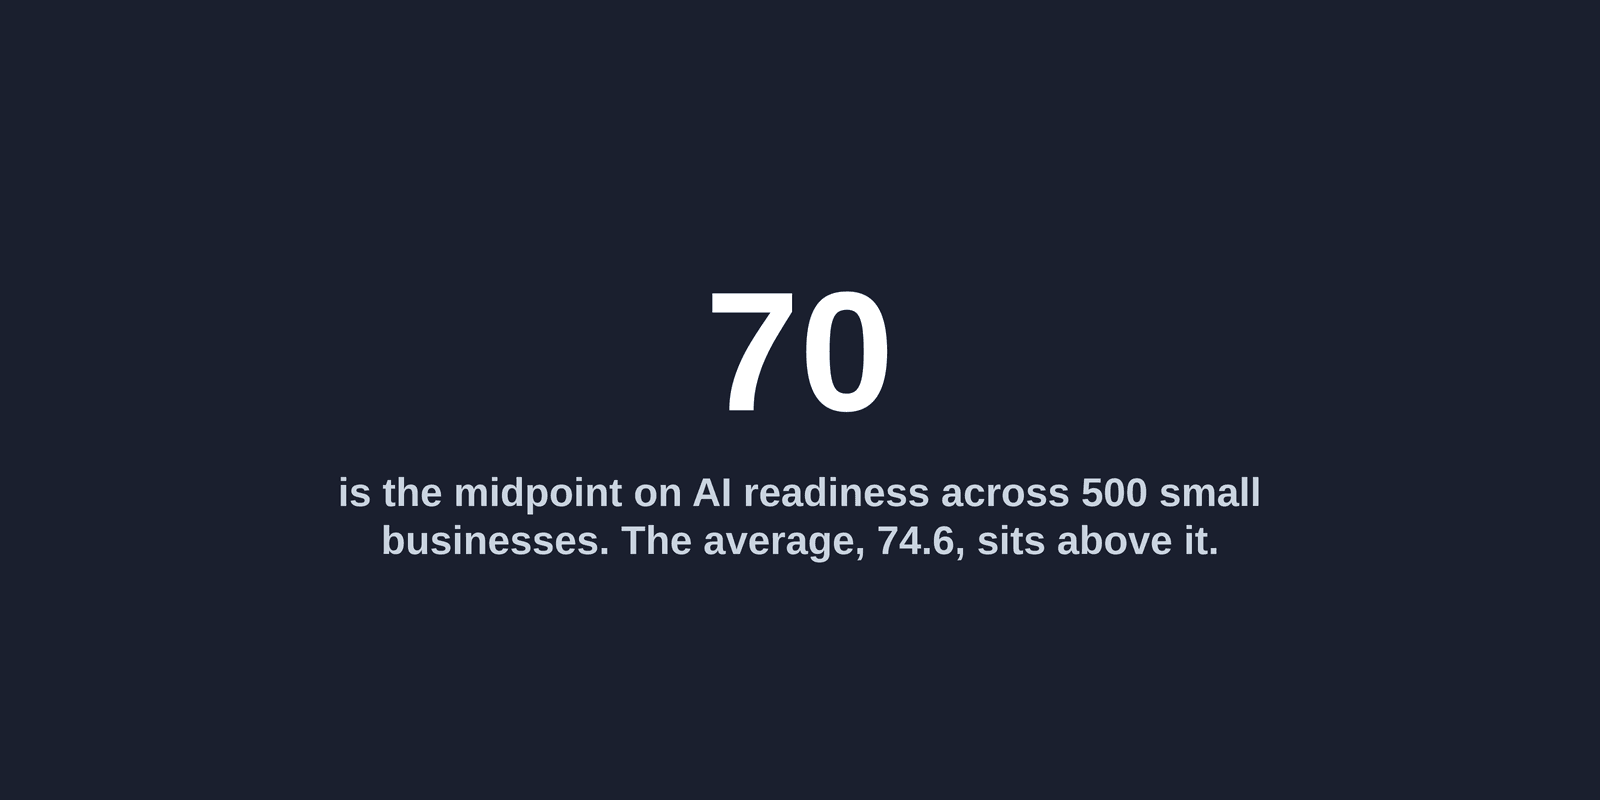
Half of the 500 small and medium businesses we scanned score 70 or below on AI readiness, even though the average for that layer is 74.6 out of 100. AI readiness is the only one of the three layers we score where the midpoint of the sample sits below the average rather than above it.
That matters because 74.6 is the number that gets reported, and it describes a business that is already doing better than more than half the sample. This post covers what the midpoint is, what a 70 on that scale actually represents, and which work moves it.
The average and the typical business are not the same number
Line all 500 businesses up in order on each of the three layers and look at the one in the middle. On technical health, the SEO basics, that middle business scores 85 out of 100 while the sample averages 84.1. On AI search visibility, whether ChatGPT, Claude and Gemini actually mention a business when a customer asks about its category, the middle business scores 74.7 while the sample averages 73.4. On both of those the midpoint sits slightly above the average.
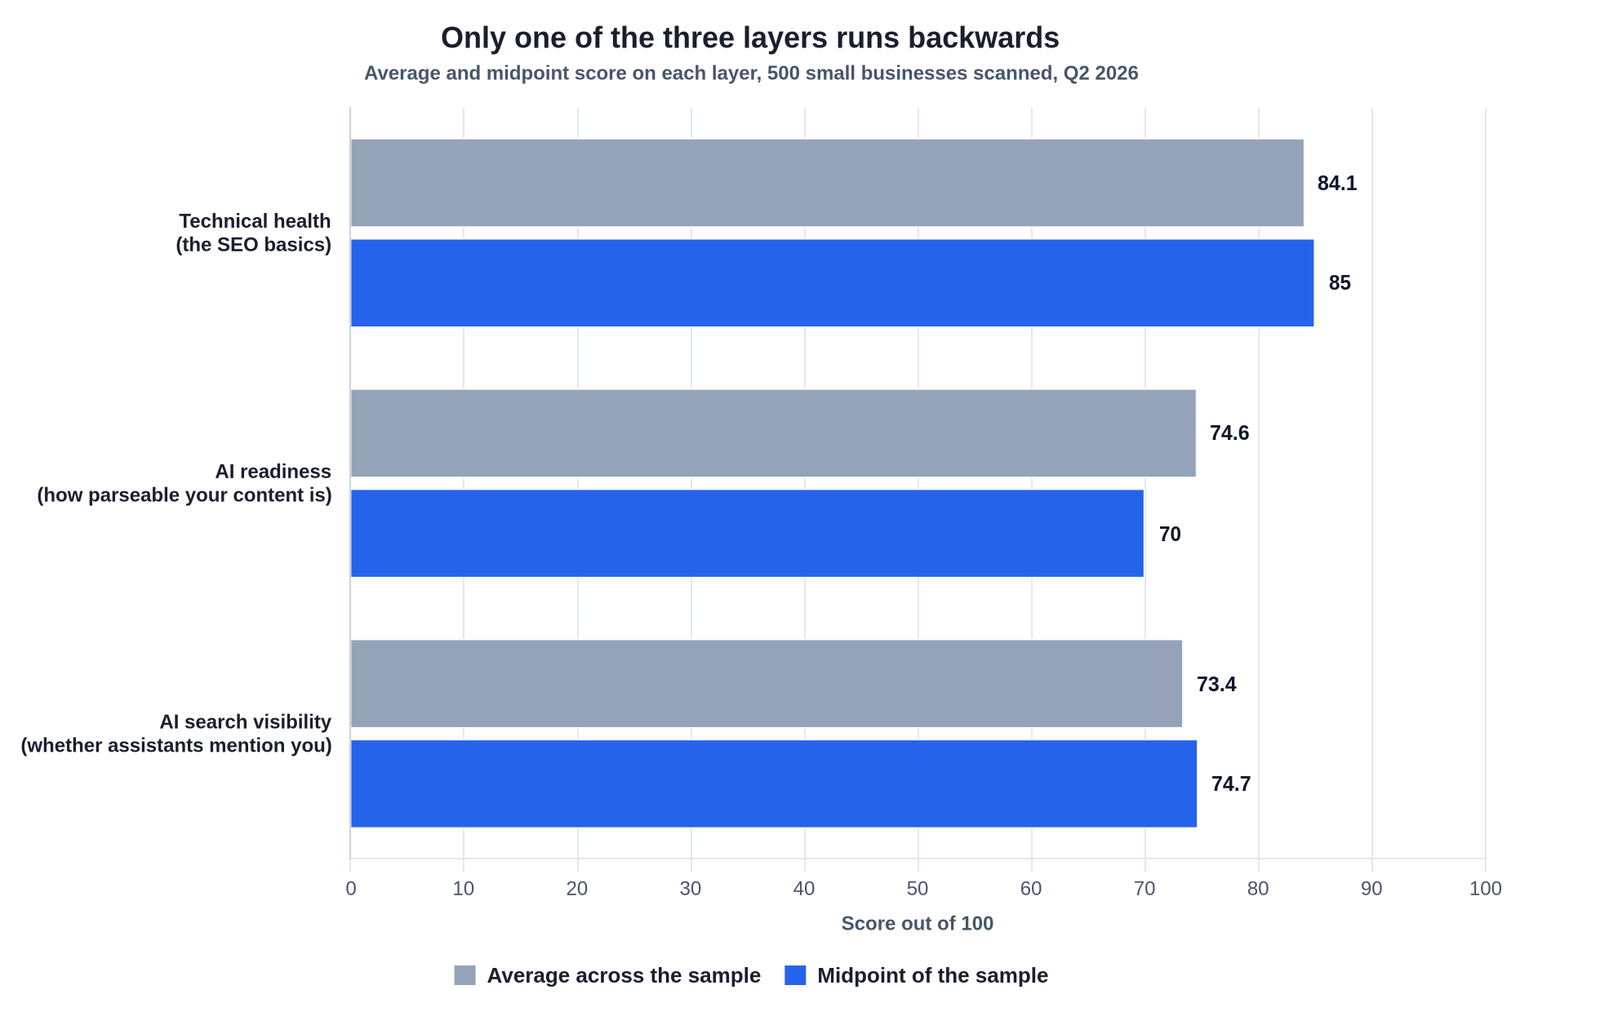
AI readiness runs the other way. The sample averages 74.6 and the middle business scores 70, which is 4.6 points lower. The standard deviation is 5.1, so nobody in the sample is a long way out on this layer. What the pattern says is narrower and more useful than an outlier story: a smaller group of businesses sitting above the pack is pulling the average up past where most of the sample actually is. If you have been comparing yourself to 74.6, you have been comparing yourself to a business that is already ahead of half the field.
What a 70 on this layer actually represents
AI readiness is not one measurement. Every readiness check we run on a site comes back at one of four levels, and those levels are scored as excellent 100, good 80, fair 60 and poor 40. The site's readiness figure is the average of its own checks, which is why the number moves in steps rather than smoothly.
On that scale, 70 is the exact midpoint between fair and good. The typical business in our sample is therefore not failing any of this and not clearing it either. Its checks land between the two levels rather than at the top of the scale. For a dental practice in Ipswich, that is the difference between a page that mentions the treatments it offers somewhere in the copy and a page that states them plainly, in the words a patient would use, with the structured data behind it saying what kind of practice this is.
Why the average sits higher than the typical business
Readiness items are choices rather than platform defaults, and that is the whole explanation. Speed and mobile rendering largely arrive with your hosting and your theme, so almost everyone gets a similar result without deciding anything. Schema markup, category language and directly answered questions do not arrive with anything. Somebody has to sit down and add them.
The prevalence figures show how few have. Schema markup, the code that tells an assistant what kind of business you are, is unresolved on 66.2 percent of the businesses we scanned. Meta description tags need work on 94.4 percent and page titles on 92.2 percent. The businesses that have done several of these deliberately sit above the pack, and there are enough of them to lift the average without moving the midpoint.
Industry barely enters into it. Across the six industries with samples large enough to report, readiness runs from 77.1 for hospitality down to 72.6 for B2B SaaS, a spread of under five points, which is smaller than the gap between the average and the midpoint of the whole sample. An independent bakery in Aberdeen and an IT support firm in Coventry are not competing on different scales here. The variation that matters sits inside industries, between the businesses that have done this work and the ones that have not.
What closes the gap, and what it will not close
The useful thing about this layer is that its items are nameable. Unlike a visibility score, which is an outcome you influence rather than set, readiness is a list of things that are either present on your site or absent from it. Schema markup for your business type. A title and description on every page that say what you do rather than what you are called. Content that answers the questions a customer asks in the words they ask them in. A florist in Bath can work out which of those are missing in an afternoon.
This is where AI My Site fits. It reports your score on each of the three layers separately, lists the readiness items that are open on your site, gives you the recommended value for each one rather than just flagging it, and ranks the list by impact so you work in order. The action plan, not just the audit.
Then keep it in proportion, because readiness is not the whole job. Technical health averaged 84.1 across the sample with a midpoint of 85, so the SEO basics are already the healthiest layer of the three and this is not a technical problem. At the other end, all 500 businesses had at least one open recommendation about how assistants describe their brand, which is a further layer again and one no amount of on-site tidying reaches on its own. The typical business carried 19.9 open recommendations in total, 9.2 of them high priority, spread across all of it.
Common mistakes to avoid
- Benchmarking yourself against the average. On AI readiness the sample averages 74.6 and the middle business scores 70. Matching the average on this layer means beating more than half the field, not keeping up with it.
- Reading a readiness score as a technical score. Technical health averaged 84.1 with a midpoint of 85. Readiness is a separate layer measuring whether your content can be parsed and quoted, not whether your site works.
- Waiting for the score to move smoothly. Each check is scored at one of four levels, so the number moves in steps. Closing one item can shift it more than you expect, and closing the next can shift it not at all.
- Assuming your industry sets the ceiling. Readiness runs from 77.1 to 72.6 across the six industries we could report, a spread of under five points. The variation that matters is inside your industry, not between industries.
- Stopping once readiness is clean. Every one of the 500 businesses had an open recommendation about how assistants describe their brand. A parseable site is not the same thing as a recommended one.
How long does this take
Working out which readiness items are open on your site is an afternoon. The items themselves vary: rewriting a title and description is minutes per page, adding schema markup for your business type is an hour or two once you have found the right template, and reworking a service page so it answers the question a customer actually asks is longer because it is writing rather than configuration. Businesses that work through a prioritised list tend to see movement over a 4 to 12 week window, depending on how many items they carry and how consistently they apply the changes. We cannot give you a date and we would not trust anyone who did. What our data supports is narrower: the typical business sits at 70 on this layer, carries 9.2 high-priority items across all layers, and the readiness items are the ones with a named fix attached.
Frequently asked questions
What is the average AI readiness for a small business?
Across the 500 businesses in our Q2 2026 scan the average is 74.6 out of 100. The more useful figure is the midpoint, which is 70, because half the sample sits at or below it. The standard deviation is 5.1, so the sample is tightly grouped on this layer.
Why is the midpoint lower than the average on this layer only?
Because a smaller group of businesses scoring above the pack pulls the average up. On technical health and on AI search visibility the midpoint sits slightly above the average instead, at 85 against 84.1 and 74.7 against 73.4. AI readiness is the only one of the three that runs the other way.
How do you measure AI readiness?
Each readiness check on a site comes back as excellent, good, fair or poor, scored 100, 80, 60 and 40, and the site's figure is the average of its own checks. A 70 is the midpoint between fair and good.
What lifts AI readiness fastest?
The items that are most often open. Schema markup is unresolved on 66.2 percent of the businesses we scanned, meta descriptions on 94.4 percent and page titles on 92.2 percent. We measured which items are open, not how much each one lifts a score, so treat that as the order to look in rather than a promise.
Which AI assistants did you measure?
ChatGPT, Claude and Gemini. Every headline number in this post is the mean of those three. We also scanned Perplexity but excluded it from the headline figures because of its reduced usage relevance, and its numbers sit in the methodology appendix.
See where you sit
An average is a poor thing to measure yourself against when half the sample sits below it. Your own number on each of the three layers is the only one that tells you anything. We have published the full Q2 2026 State of AI Search benchmark, including the average and midpoint for all three layers, the issue prevalence table, and the breakdown by industry, country and platform, so you can see how you compare before you change anything.
Read the full Q2 2026 benchmark to see where you sit.
AI My Site Research · Q2 2026 · n=500. AI readiness mean 74.6, median 70, standard deviation 5.1. Technical health mean 84.1, median 85. AI search visibility mean 73.4, median 74.7. Readiness is the per-site average of checks scored excellent 100, good 80, fair 60 and poor 40. We measured AI search visibility, not revenue or conversion. Figures are a Q2 2026 point-in-time snapshot.
Rather someone did this for you?
With One Site we rebuild your website and run it for you: a review every fortnight, technical fixes done ourselves, and the content changes you approve.
See One Site — £60 a month →